

Financial Overview
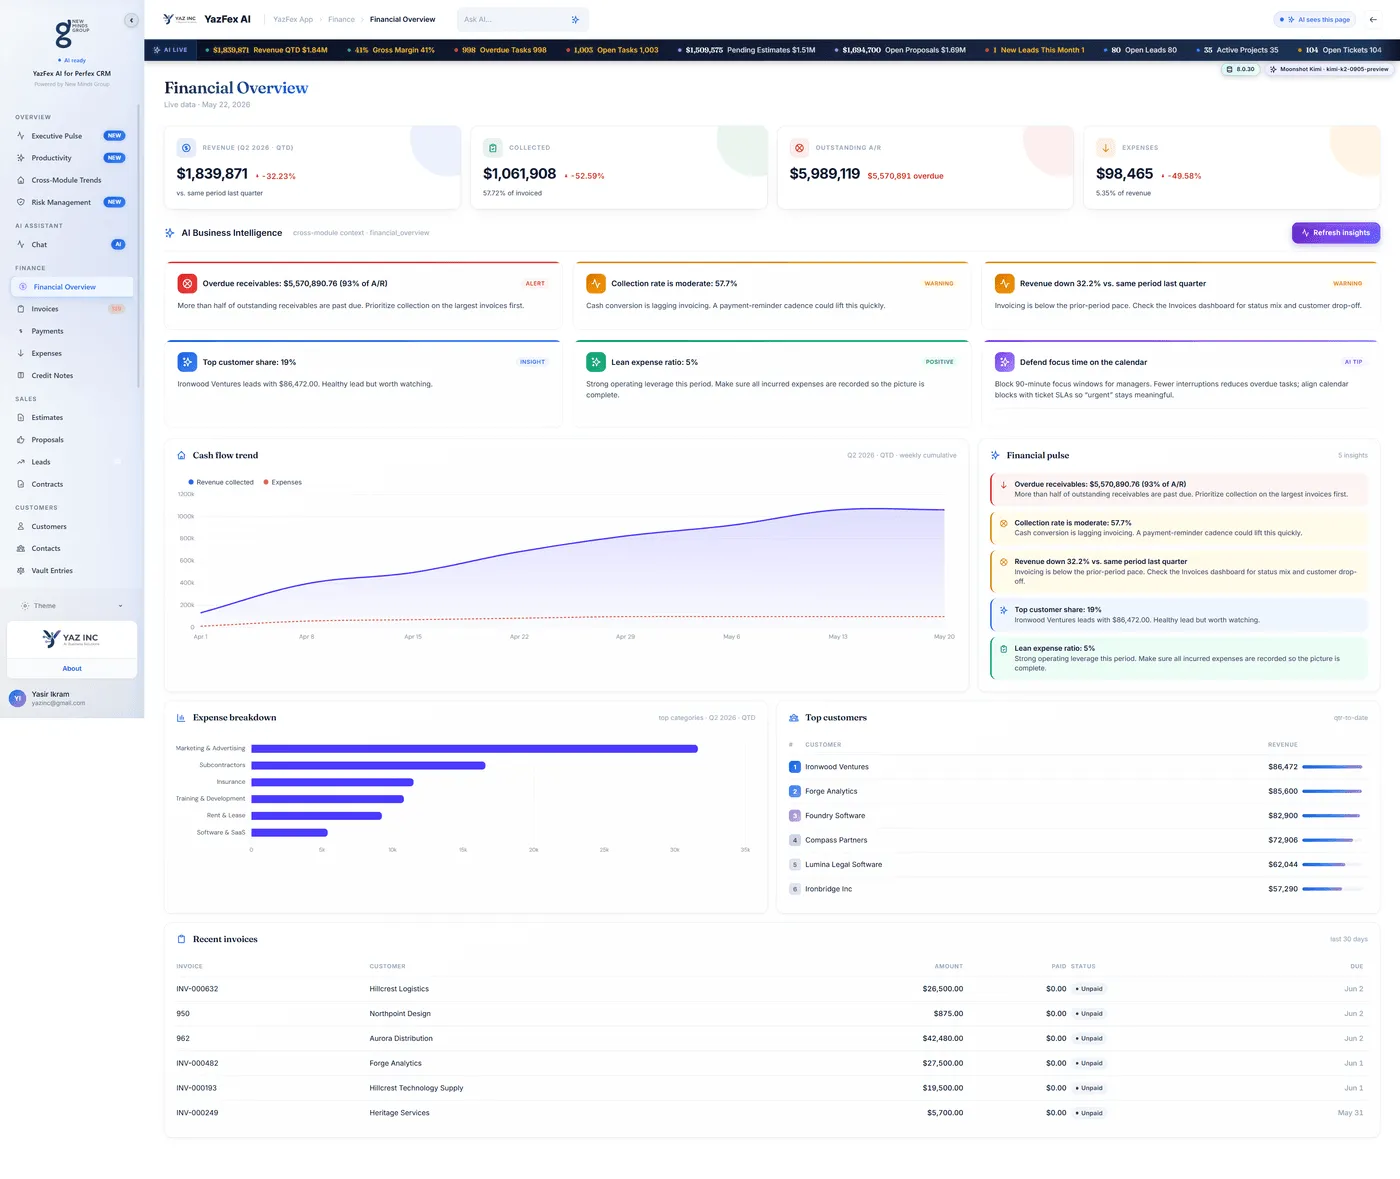
Quarter-aware revenue and collection story with cash flow visualization, top customers, recent invoices, expense categories, and narrative insight cards.
What Problem It Solves
Finance and owners need a fast read on cash performance without building a separate BI warehouse first.
What The User Sees
- KPI tiles for Revenue, Collections, A/R, and Expenses
- Weekly cash flow comparison chart (Revenue vs Expenses)
- Top customers ranked by total revenue contribution
- Recent invoices table with status badges
- Auto-generated financial insight cards
Honest Note: KPI totals use the system base currency. Multi-currency operations aggregate in the default currency.
This dashboard features automatic contextual integration. When YazFex AI is active, the assistant is injected into the side-panel, automatically reading these records.
Related Finance Modules
Invoices Dashboard
Invoice-centric analytics with overdue highlights, status splits, and assistant-friendly context when YazFex AI is active.
Payments Dashboard
Historical collection analytics, payment modes split, and daily velocity tracking to monitor incoming cash flow pacing.
Expenses Dashboard
Visual category breakdown of business expenses, tax category maps, and correlation with billing status.